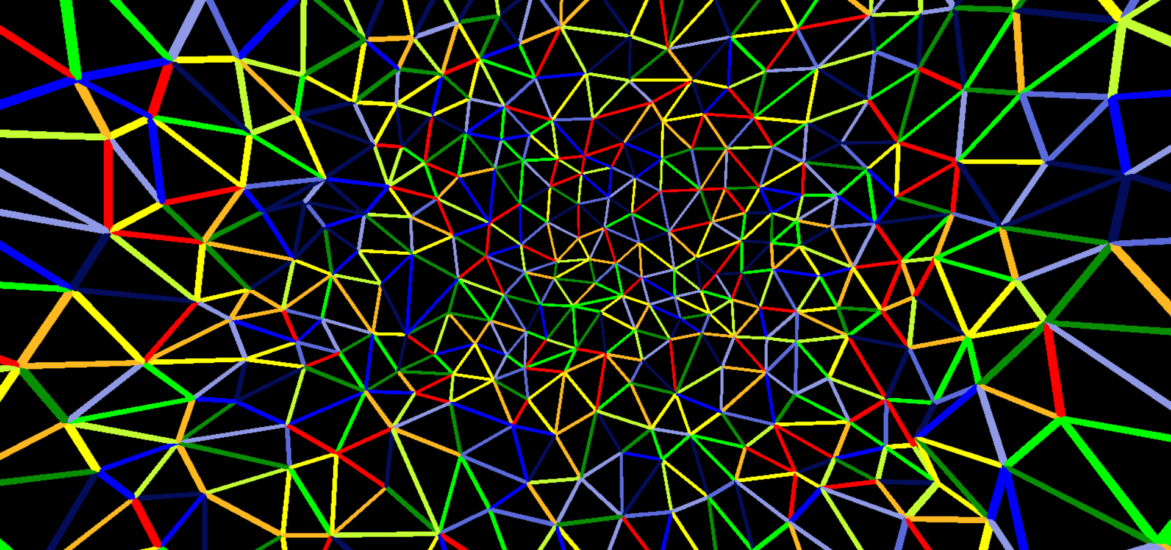
heat map
A heat map is a visualization approach that uses varying gradations of colour (in this case fading from red -> orange -> yellow -> light green -> dark green -> dark blue -> light blue) to represent the varying degrees of some metric. In this case, what is being measured is how many times an edge has been visited. Red = one time, light blue = 10 times (and then it cycles around again indefinitely). It looks a bit like an infrared image or like satellite imagery and gives the impression of differing areas of temperature.
What this technique serves to reveal in this case is the distribution of activity (the moving spheres) across the structure. At the start, they congregate in the same area and gradually move across the object until all of the lines have been revealed. After the initial construction phase, the apparent order breaks down and the action of the spheres seems to be fairly evenly distributed throughout in an unpredictable and constantly shifting way. They are not favouring one area over another.
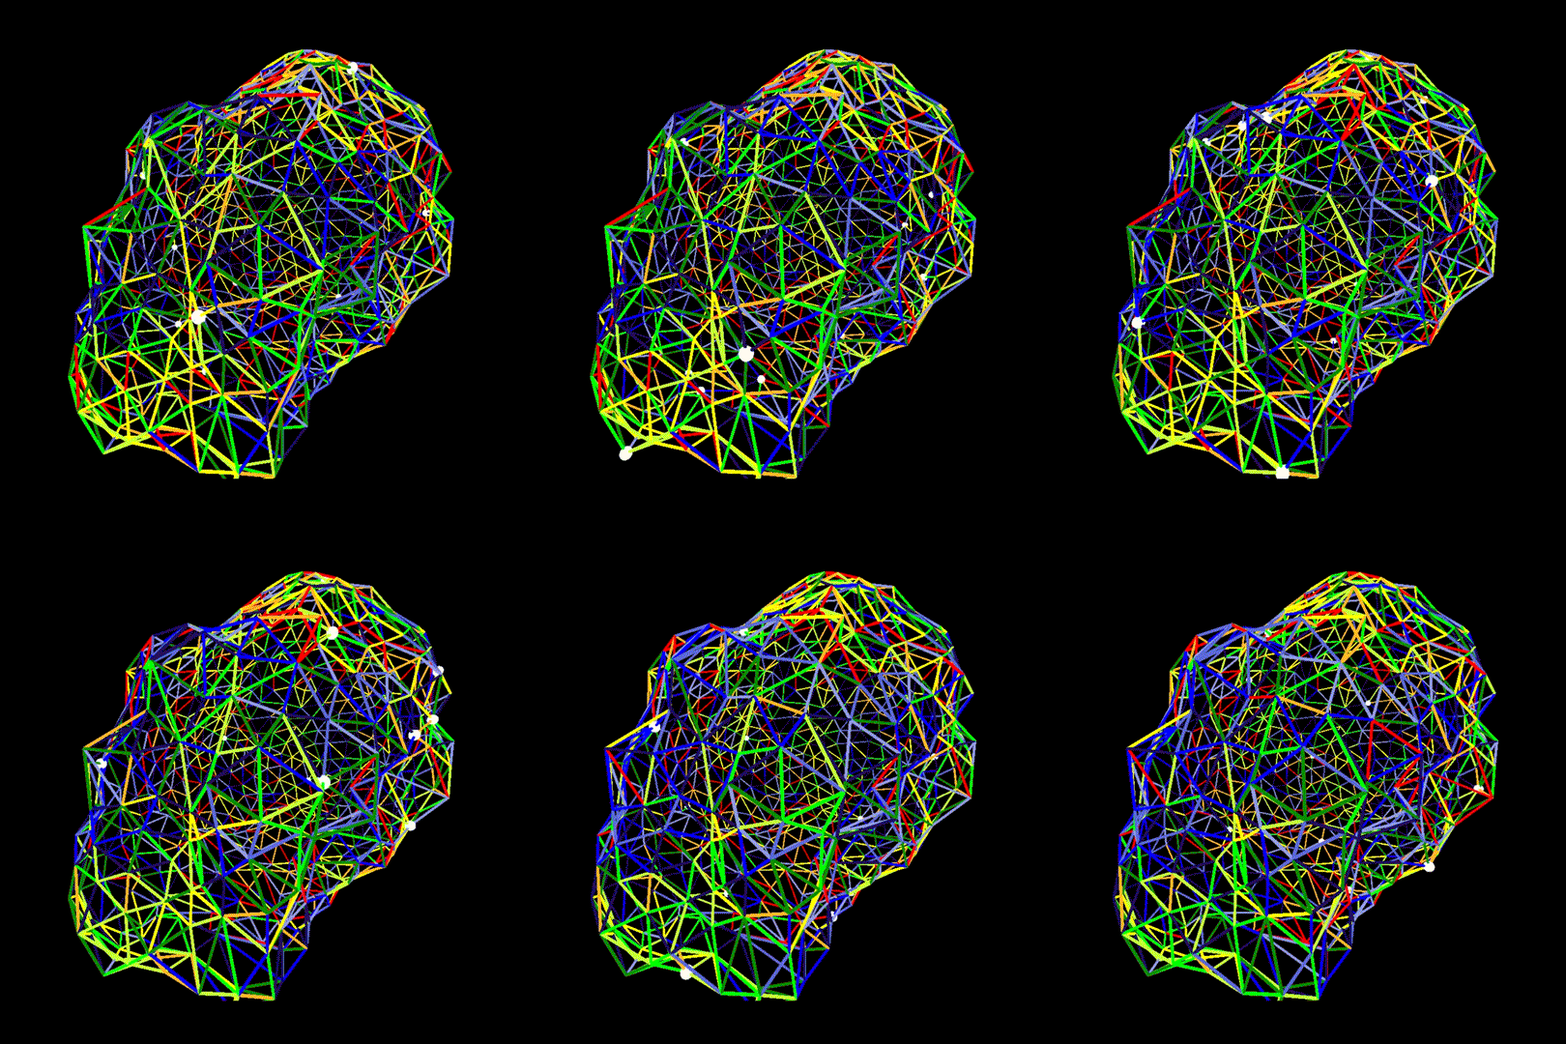
video and stills
Click the image below to see a collection of videos, gifs, and still images drawn from recordings of interactions with this software.
prints and paintings
Click the image below to go to the online shop for more information.

instructions:
‘q’ – add sphere (max. 10)
‘w’ – remove sphere
‘p’ – playback on/off
‘c’ – change from cylinders to lines
‘s’ – show or hide spheres
you can use your mouse to move the object to pan, orbit, rotate.
